Python library for SBGN
Matthias König 
Humboldt-Universität zu Berlin, Faculty of Life Science, Institute of Biology, ITB
University of Stuttgart, Institute of Structural Mechanics and Dynamics in Aerospace Engineering
February 2, 2026
SBGN
- Systems Biology Graphical Notation1
- Standardise graphical notation used in maps of biological processes
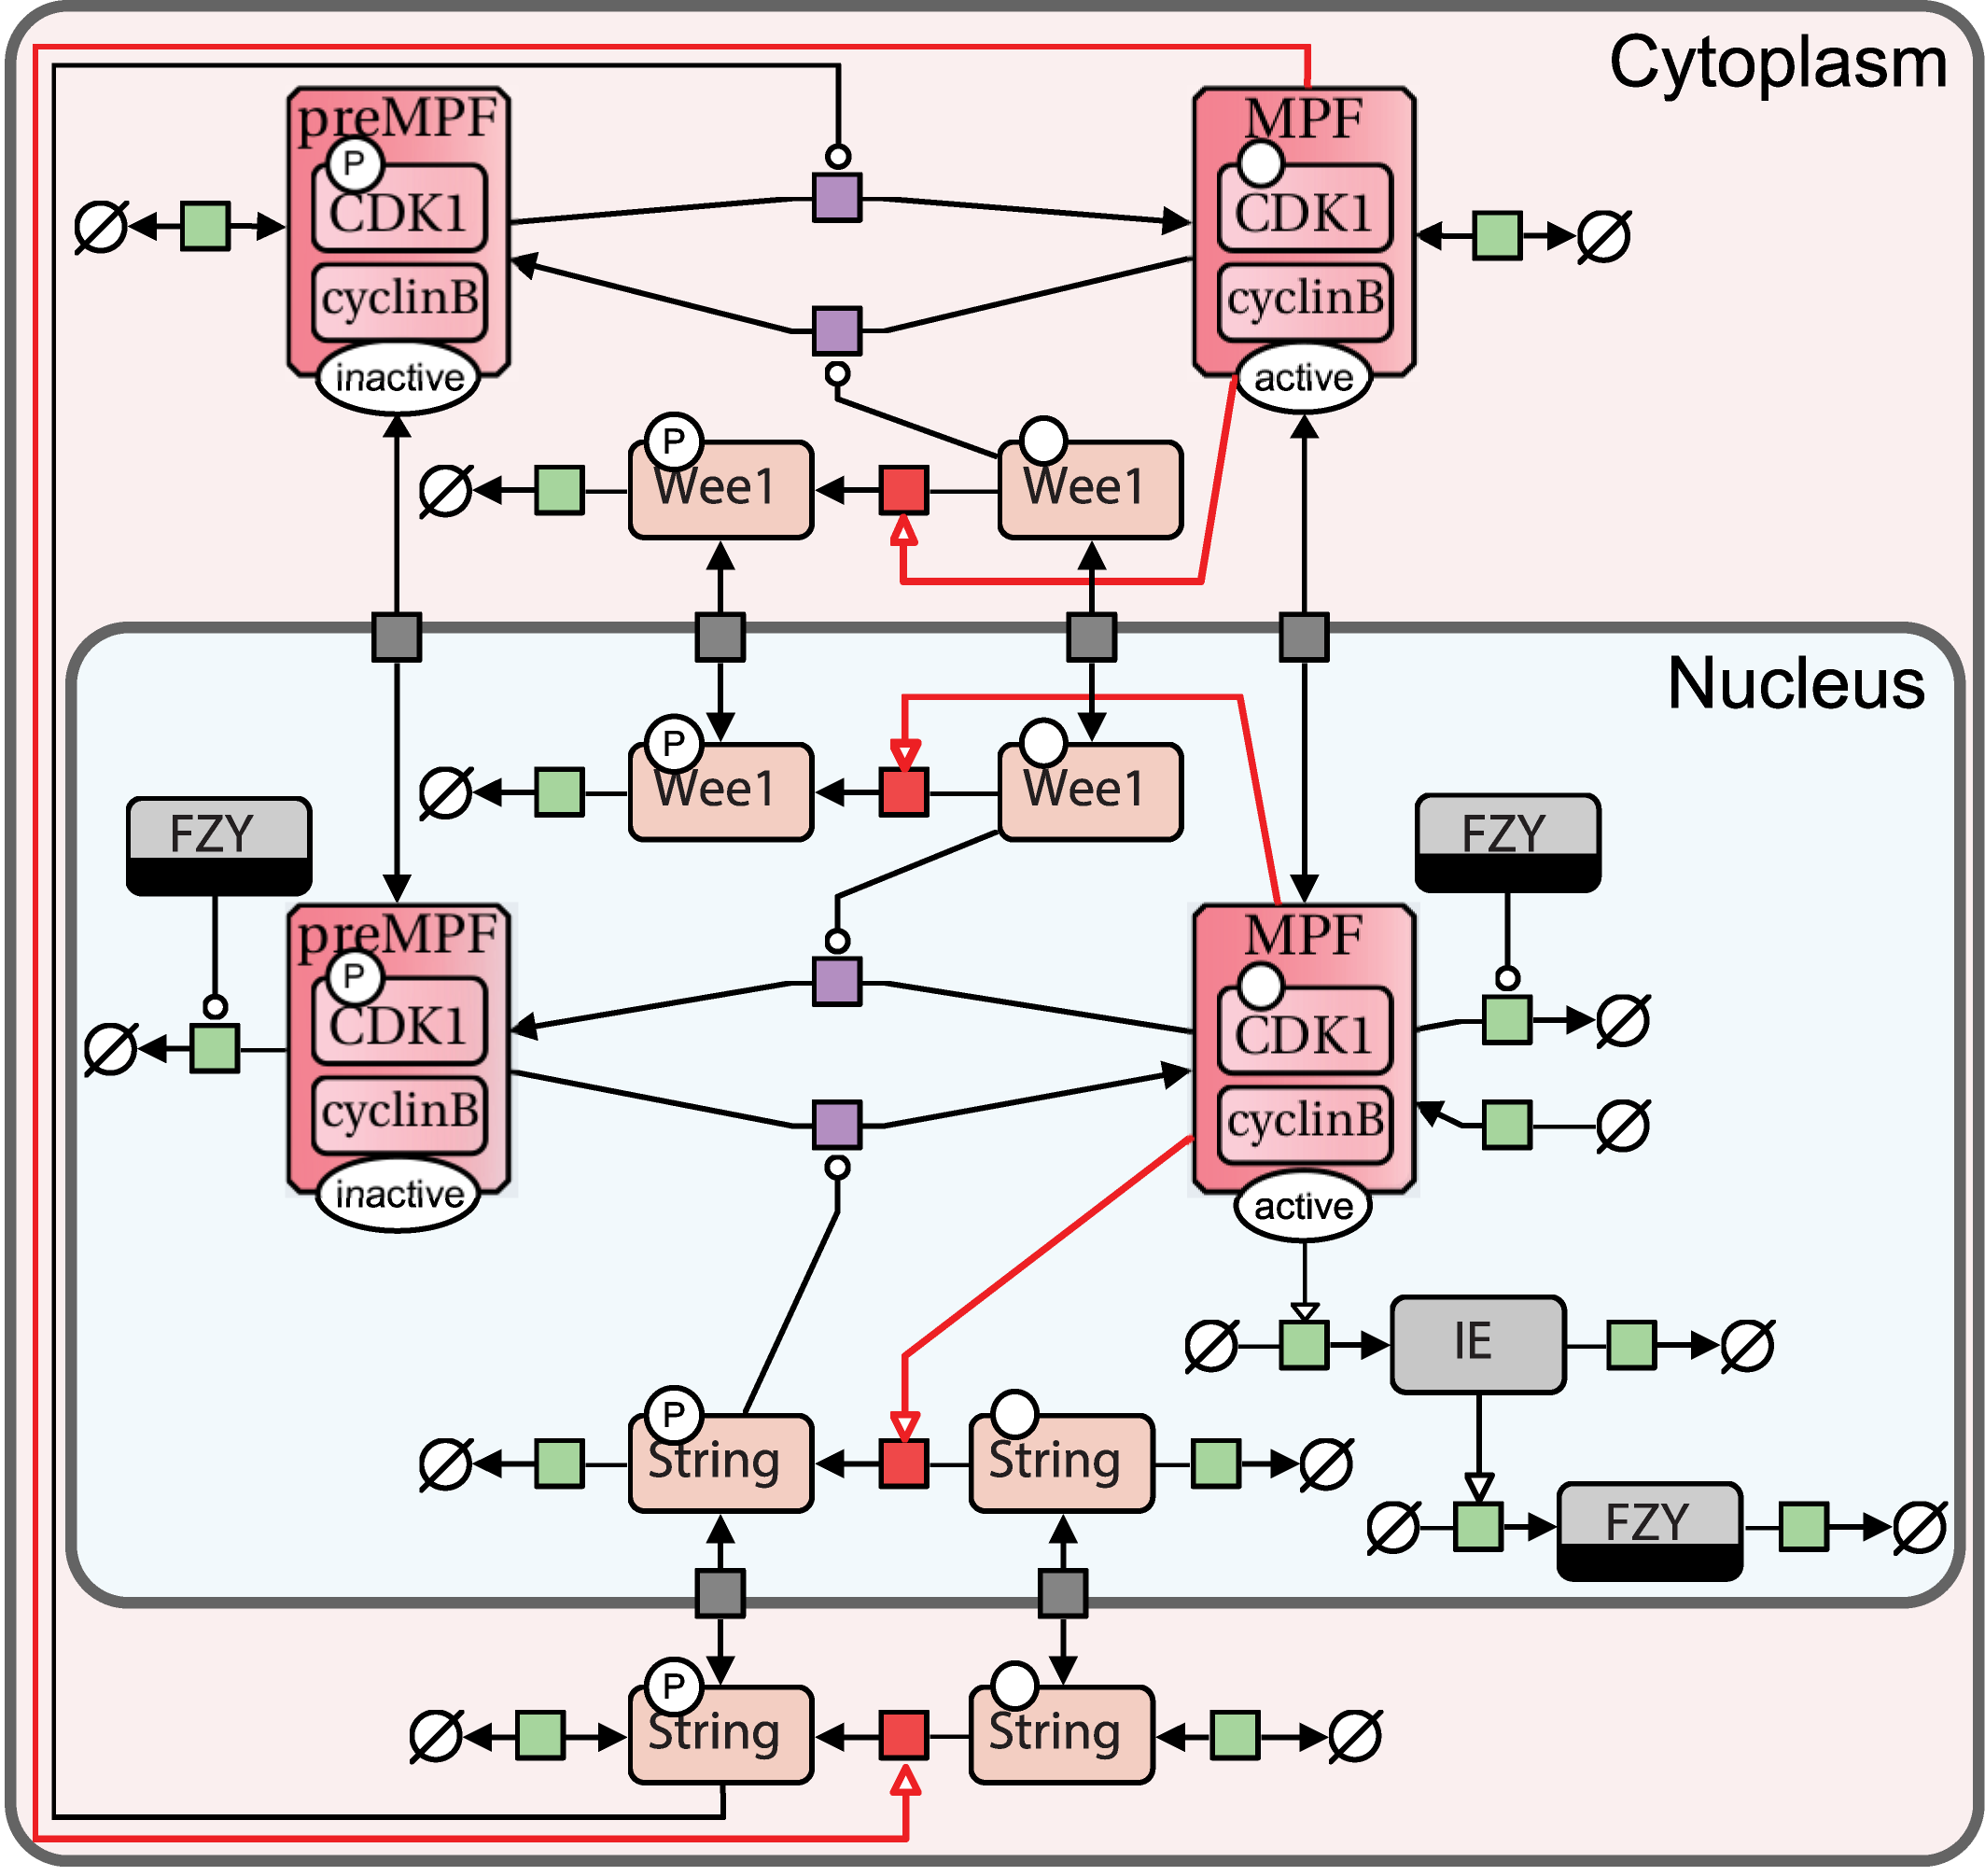
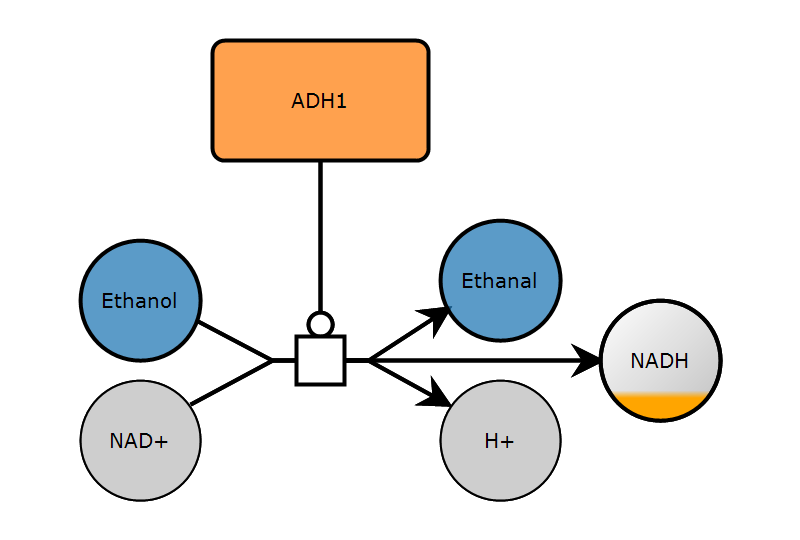
- Process Description (PD)2: temporal courses of biochemical interactions in a network
- Entity Relationship (ER)3: all relationships between participates, regardless of the temporal aspects
- Activity Flow (AF)4: flow of information between biochemical entities in a network
libsbgnpy
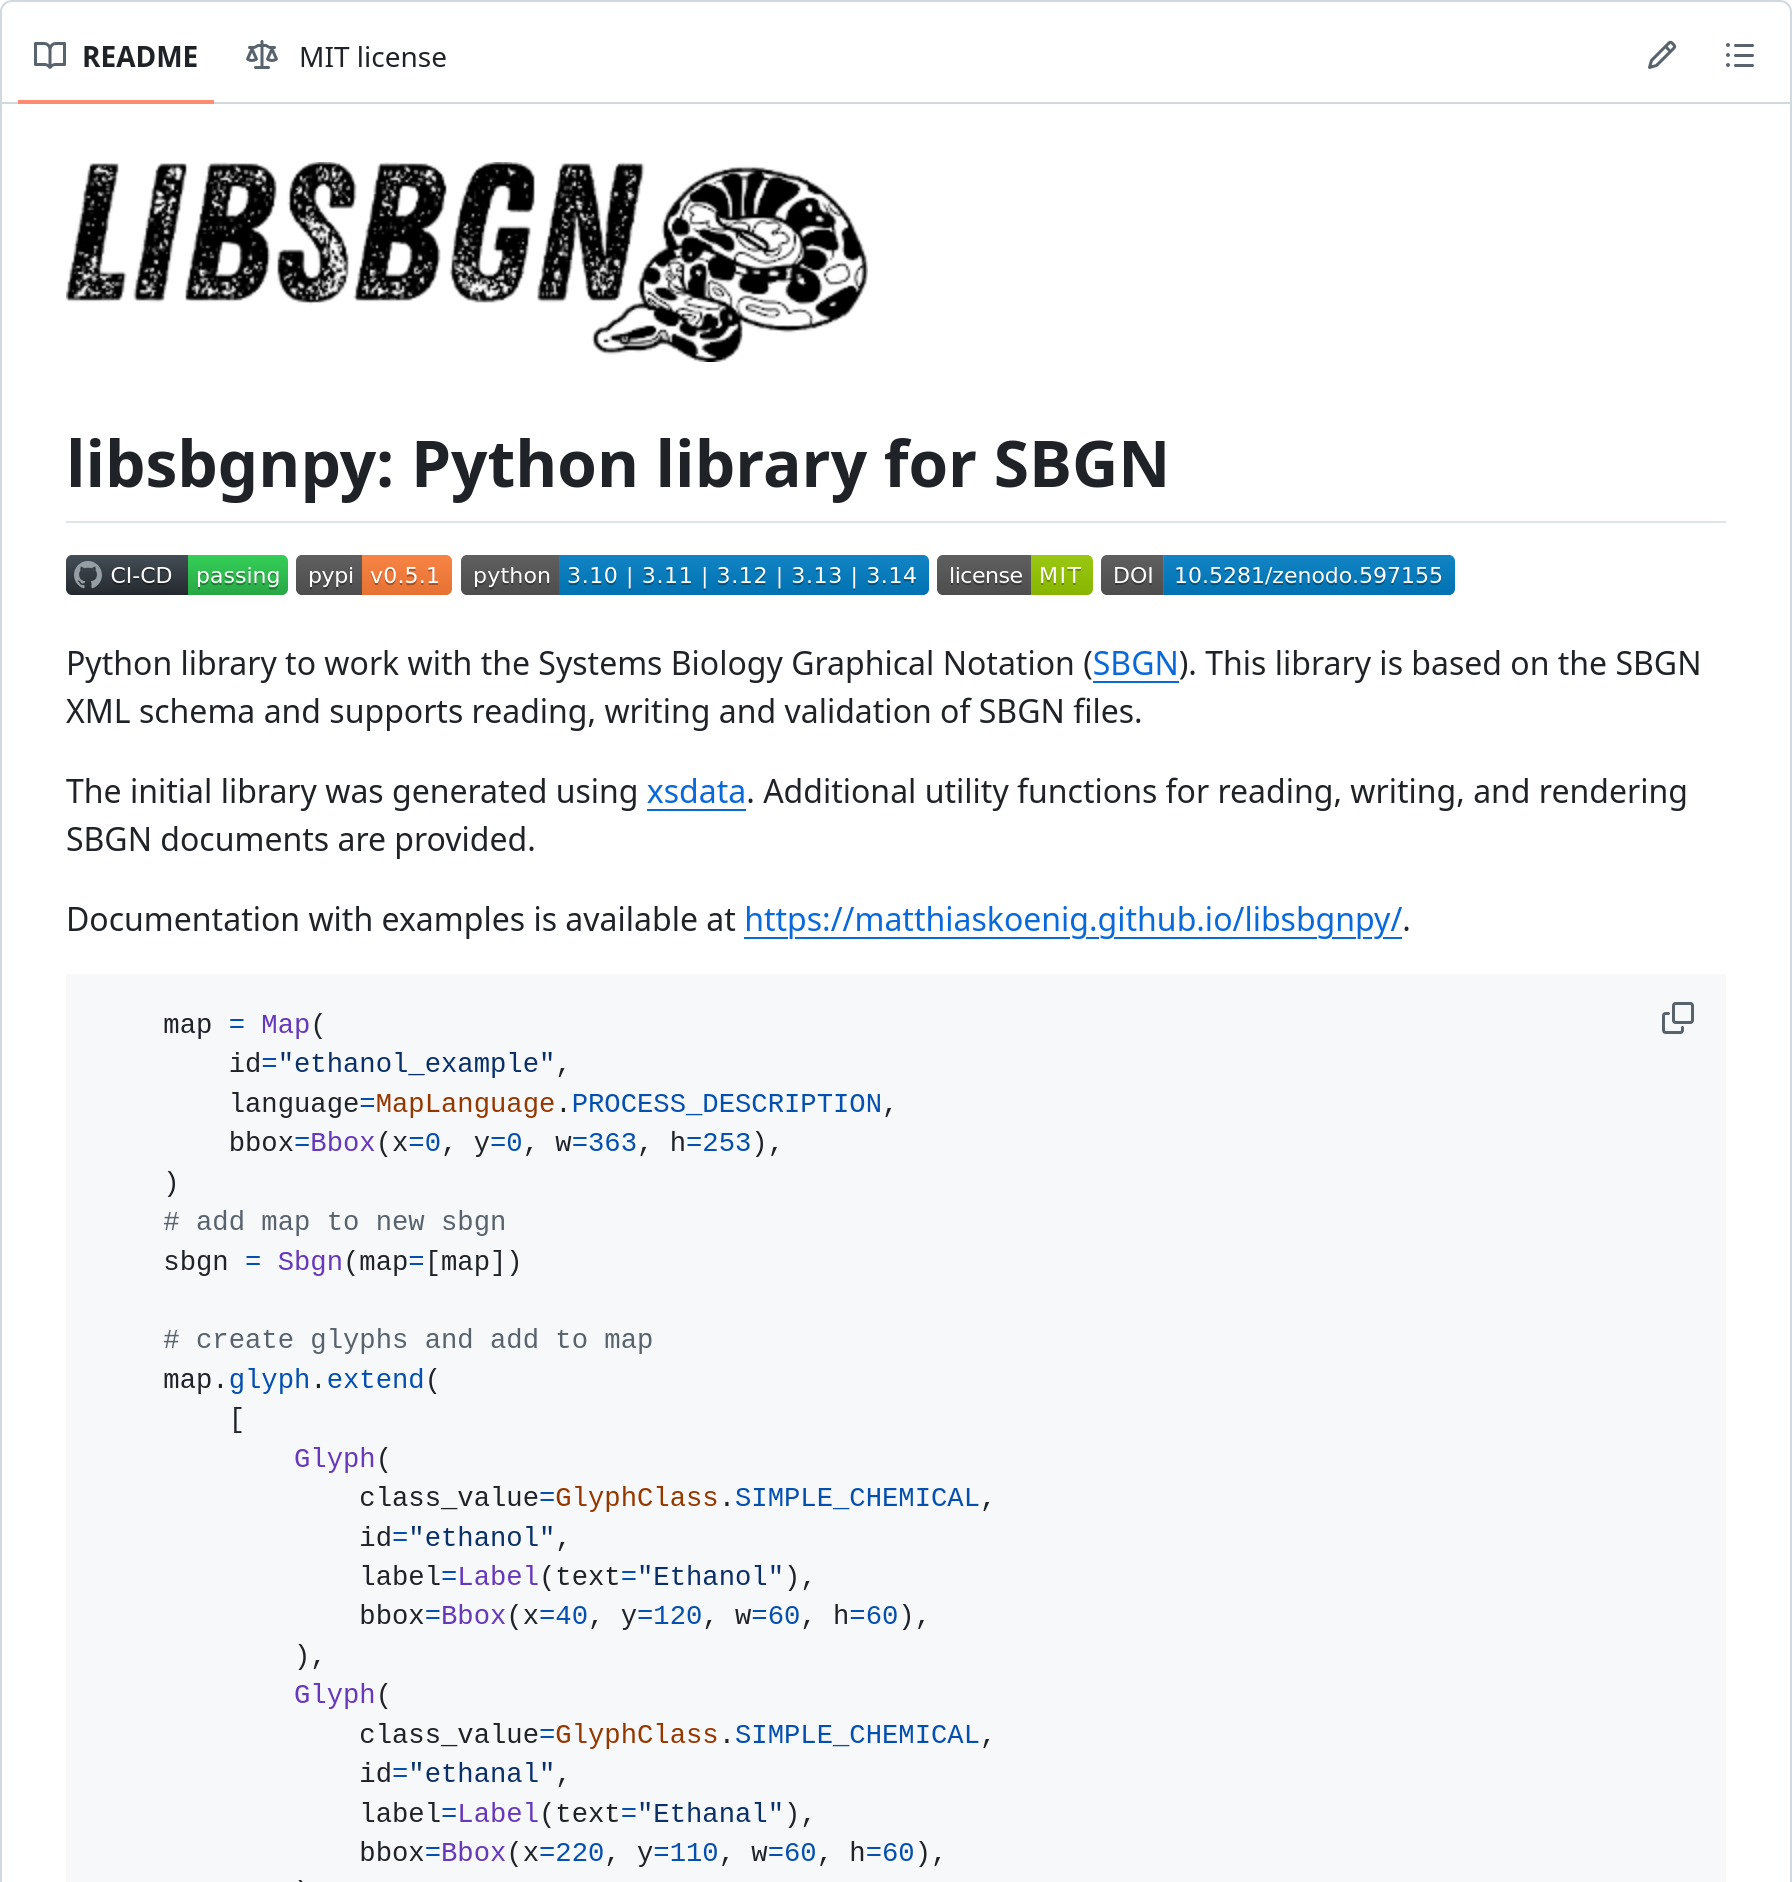
- Python library for SBGN1
- Supports AF, PD, ER
- Supports libsbgn/0.3
- new: xsdata v26.1 dataclasses (stricter validation)
- new: py3.10 - py3.14 support
- new: better documentation: https://matthiaskoenig.github.io/libsbgnpy/
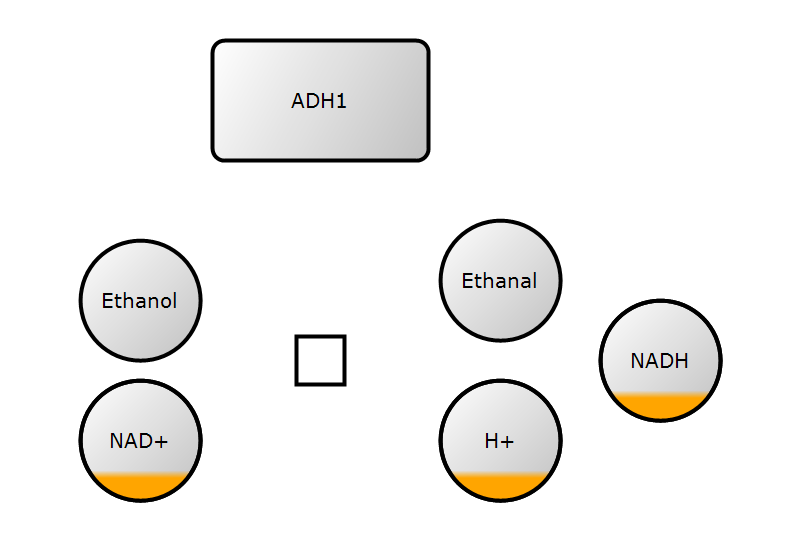
2. Add glyphs
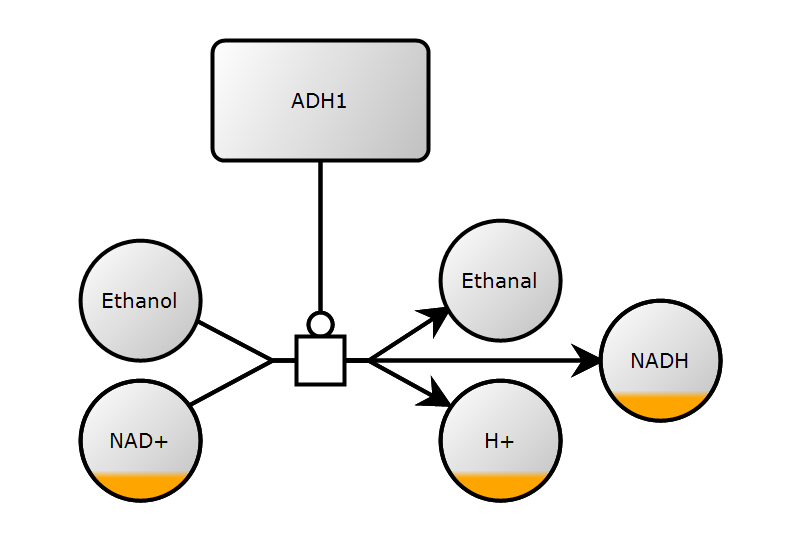
3. Add arcs
5. Save and render
Want to know more


Bergmann, Frank T., Tobias Czauderna, Ugur Dogrusoz, Adrien Rougny, Andreas Dräger, Vasundra Touré, Alexander Mazein, Michael L. Blinov, and Augustin Luna. 2020. “Systems Biology Graphical Notation Markup Language (SBGNML) Version 0.3.” Journal of Integrative Bioinformatics 17 (2-3): 20200016. https://doi.org/10.1515/jib-2020-0016.
König, Matthias. 2026. “Libsbgnpy: Python Library for SBGN.” Zenodo. https://doi.org/10.5281/zenodo.18455396.
Le Novère, Nicolas, Michael Hucka, Huaiyu Mi, Stuart Moodie, Falk Schreiber, Anatoly Sorokin, Emek Demir, et al. 2009. “The Systems Biology Graphical Notation.” Nature Biotechnology 27 (8): 735–41. https://doi.org/10.1038/nbt.1558.
Mi, Huaiyu, Falk Schreiber, Stuart Moodie, Tobias Czauderna, Emek Demir, Robin Haw, Augustin Luna, Nicolas Le Novère, Anatoly Sorokin, and Alice Villéger. 2015. “Systems Biology Graphical Notation: Activity Flow Language Level 1 Version 1.2.” Journal of Integrative Bioinformatics 12 (2): 265. https://doi.org/10.2390/biecoll-jib-2015-265.
Rougny, Adrien, Vasundra Touré, Stuart Moodie, Irina Balaur, Tobias Czauderna, Hanna Borlinghaus, Ugur Dogrusoz, et al. 2019. “Systems Biology Graphical Notation: Process Description Language Level 1 Version 2.0.” Journal of Integrative Bioinformatics 16 (2): 20190022. https://doi.org/10.1515/jib-2019-0022.
Sorokin, Anatoly, Nicolas Le Novère, Augustin Luna, Tobias Czauderna, Emek Demir, Robin Haw, Huaiyu Mi, Stuart Moodie, Falk Schreiber, and Alice Villéger. 2015. “Systems Biology Graphical Notation: Entity Relationship Language Level 1 Version 2.” Journal of Integrative Bioinformatics 12 (2): 264. https://doi.org/10.2390/biecoll-jib-2015-264.
van Iersel, Martijn P., Alice C. Villéger, Tobias Czauderna, Sarah E. Boyd, Frank T. Bergmann, Augustin Luna, Emek Demir, et al. 2012. “Software Support for SBGN Maps: SBGN-ML and LibSBGN.” Bioinformatics 28 (15): 2016–21. https://doi.org/10.1093/bioinformatics/bts270.