Curation guidelines (study format 1, archived)
Archived at the cutover to study format 2
This guide describes study format 1. Curate new studies and the converted studies with the curation guidelines. A study that is still in study format 1 is only fixed so that pkdb migrate converts it; the cutover page lists the reasons why a study stays in format 1 and their fixes. The setup, validation and upload of format 1 studies are described in Getting started at the tag v1-final.
Curate pharmacokinetic studies by connecting each measurement to its subjects, interventions and publication source. Complete Getting started for tool setup, VS Code configuration, accounts and command-line instructions.
Curation workflow
- Choose a study. Coordinate the assignment in the
curation issue tracker.
Label the issue with
curationand the substance, for exampledapagliflozin. - Collect the source material. Create the study folder and keep the publication, figures, tables and workbook together.
- Describe the experiment. Fill in the study metadata, groups and individuals, and interventions, preserving the publication's descriptions.
- Extract the measurements. Transcribe tables and text, digitize figure panels, and map the workbook columns to outputs and timecourses.
- Review the data. Check values, units, uncertainty, population assignments and dosing schedules against the source. Record ambiguities and curation decisions in comments.
- Validate and upload. Follow the validation and upload instructions, resolve errors and inspect the uploaded study in PK-DB.
- Submit the source changes for review. Review the Git diff, commit the
study files on your curation branch and open a pull request targeting
develop. Link the curation issue so the source changes and review stay connected. Uploading to PK-DB and submitting the repository changes are separate steps.
Use the curation vocabulary to look up measurement types, substances and allowed values. Report missing terms or unclear behavior in the PK-DB issue tracker.
Study data
Study folder
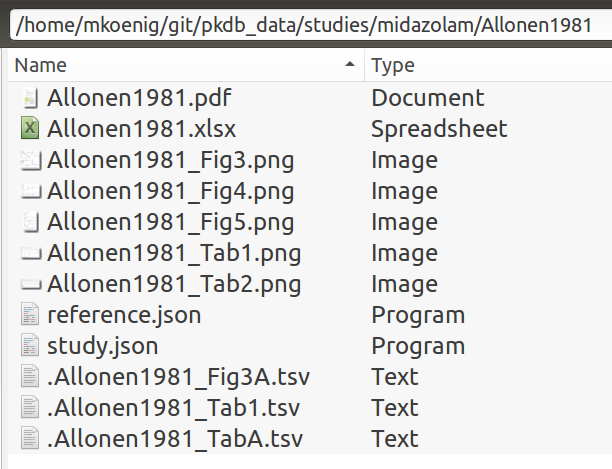
For the study upload to work, a specific folder/file structure is required for the <study_dir>. This folder contains files for the study PDF, figures & tables, study, reference information and curated data (excel file).
The first step is to create a folder for the study containing the relevant files.
- The folder name is
<STUDYNAME>, e.g.Allonen1981, the folder is created in the folder for the given substance, e.g. formidazolamthis isstudies/midazolam/Allonen1981. - folder containing the pdf as
<STUDYNAME>.pdf, e.g.Allonen1981.pdf. - folder contains additional files related to the study, e.g,
- Tables, named
<STUDYNAME>_Tab[1-9]*.png, e.g.Allonen1981_Tab2.png. - Figures, named
<STUDYNAME>_Fig[1-9]*.png, e.g.Allonen1981_Fig1.png. - Excel file named
<STUDYNAME>.xlsx, e.g.Allonen1981.xlsx.
- Tables, named
Tables and figures are named according to the naming in the PDF document. Figures should be saved as *.png using snapshots from the PDF (figure quality as good as possible).
Information about the study is stored in the study.json which we will create in the following steps. Information about the reference for the study is stored in the reference.json (this file is created automatically if a pubmed id exists for the study and should not be altered manually).
In addition, the folder may contain hidden data files named .<STUDYNAME>_Tab[1-9]*.tsv or .<STUDYNAME>_Fig[1-9]*.tsv which can be ignored. These files are generated from the Excel document when uploaded. The information is that the Excel file is the primary data source, i.e. the *.tsv information is redundant and will be overwritten!
Study JSON
Record study metadata, groups, individuals, interventions and measurement
mappings in study.json. Edit the existing file, or create one in the study
folder using the following template. The
VS Code setup covers JSON editing
and formatting.
{
    "sid": 123456789,
    "name": "STUDYNAME",
    "reference": 123456789,
    "licence": "closed",
    "access": "private",
    "creator": "mkoenig",
    "curators": [
        ["mkoenig", 0.5]
    ],
    "collaborators": [],
    "descriptions": [],
    "comments": [],
    "groupset": {
        "descriptions": [],
        "comments": [],
        "groups": []
    },
    "individualset": {
        "descriptions": [],
        "comments": [],
        "individuals": []
    },
    "interventionset": {
      "descriptions": [],
      "comments": [],
      "interventions": []
    },
    "outputset": {
      "descriptions": [],
      "comments": [],
      "outputs": [],
      "timecourses": []
    }
}
name field with the $STUDYNAME (e.g. Allonen1981, the creator and curator and collaborator fields with existing users
(creator is a single user, whereas curators is a list of users),
the sid and reference field with the PubmedId of the study.
* The reference field is optional. If no pubmed entry exist for publication a reference.json should be build manually (please ask what to do in such a case).
* The access field sets study visibility to public or private. Server-side assignments control access to private studies; contributor fields record attribution. See Study access and curation.
* The curators is a list which consists of either curator names (e.g. mkoenig) or a curator name with a curation score between 0.0 and 5.0 (e.g. [mkoenig, 3.5])
* The licence field provides information on the licence of the publication. This is either open in case of Open Access publications or closed otherwise. Images and the PDF are only shown publicly if the publication is Open Access.
Comments and descriptions
The study and all sets allow to store additional annotions either in the form of descriptions or comments.
Descriptions are quotations from the publication to substantiate and support the curated data.
comments provide the possibility to store information from individual curators. Examples of comments are stating incorrect units, missing data or strange conversions of data.
Groups and individuals
Groups
The next step is the curation of the group information, i.e., which groups where studied. The information is stored in the groupset of the following form.
Retrieve group information from the publication and copy it in the description of the groupset. The top group containing all subjects must be called all.
The main steps for defining groups is to set the name and count of the group (with name being all for the top-level group, or an arbitrary descriptive name
otherwise; the count is the number of subjects in the group. In addition to this core information a group is characterized by characteristica.
An overview over the available characteristica and possible choices is available from https://alpha.pk-db.com/curation
{
  "groupset": {
    "descriptions": [
      "The subjects were six healthy volunteers, three males and three females, aged 21.0 ± 0.9 years (range 20 to 22 years) and weighing 63 ± 11 kg (range 50 to 76 kg). All were nonsmokers. Subjects abstained from all methylxanthine containing foods and beverages during the entire period of the study. Compliance with this requirement was assessed by questioning at each presentation for blood sampling or urine delivery."
    ],
    "comments": [],
    "groups": [
      {
        "count": 20,
        "name": "all",
        "characteristica": [
          {
            "measurement_type": "species",
            "choice": "homo sapiens"
          },
          {
            "measurement_type": "healthy",
            "choice": "Y"
          },
          {
            "measurement_type": "overnight fast",
            "choice": "Y"
          },
          {
            "measurement_type": "fasted",
            "min": "10",
            "max": "14",
            "unit": "hr"
          }
        ]
      }
    ]
  }
}
characteristica, shared characteristica of groups can be defined via parent groups.
* Look up allowed categorical values in the curation vocabulary.
* The group names have to be unique within the groupset and should be descriptive, e.g., smoker, nonsmoker, contraceptive.
* All groups require a name, all groups with exception of all require parent field.
"parent": "string",
All available fields for characteristica on group are:
{
    "measurement_type": "categorial",
    "choice": "categorial|string",
    "count": "int",
    "mean": "double",
    "median": "double",
    "min": "double",
    "max": "double",
    "sd": "double",
    "se": "double",
    "cv": "double",
    "unit": "categorial"
}
Individuals
Individuals are curated very similar to groups with the exception that individuals must belong
to a given group, i.e., the group attribute must be set. Individuals are most often defined based on spreadsheet mappings.
See for instance below individuals which are defined via a table.
Information in the excel sheets can be referred to via using the source attribute stating the respective sheet (e.g. Tab1 or Fig2).
The columns can then be matched via using the col==col_header syntax. In the example below for all the individuals the name, group, age, weight and sex are defined in the sheet Tab1.
"individuals": [
      {
        "source": "Tab1",
        "figure": "Tab1",
        "name": "col==subject",
        "group": "col==group",
        "characteristica": [
          {
            "measurement_type": "age",
            "value": "col==age",
            "unit": "yr"
          },
          {
            "measurement_type": "weight",
            "value": "col==weight",
            "unit": "kg"
          },
          {
            "measurement_type": "sex",
            "choice": "col==sex"
          }
        ]
      }
    ]
Interventions
The next step is to curate the interventions which were applied in the study.
The interventions define what was done or given to a group or individual. Most of the time this
is a dosing intervention.
"interventionset": {
    "descriptions": [],
    "interventions": [
      {
        "name": "glciv",
        "measurement_type": "dosing",
        "substance": "glucose",
        "route": "iv",
        "application": "single dose",
        "form": "solution",
        "value": "0.5",
        "unit": "g/kg",
        "time": "0",
        "time_unit": "hr"
      }
    ]
}
{
    "name": "string",
    "measurement_type": "categorial",

    "substance": "categorial (substance)",
    "route": "categorial {oral, iv}",
    "application": "categorial {'single dose', 'multiple dose', 'continuous injection'}",
    "form": "categorial {'tablete', 'capsule', ...}",
    "time": "double||double||double ...",
    "time_unit": "categorial",

    "choice": "categorial|string",
    "value": "double",
    "mean": "double",
    "median": "double",
    "min": "double",
    "max": "double",
    "sd": "double",
    "se": "double",
    "cv": "double",
    "unit": "categorial"
}
Multiple dosing
https://github.com/matthiaskoenig/pkdb/issues/685
Multiple doses can be encoded via the time field
0|12|40|60: syntax1, give the timepoints; dosing at 0 [time_units], 12 [time_units], 40 [time_units], ...S0T24R3: syntax1, give the start timepoint, interval time and repeats (parse with regular expressions); dosing equivalent to 0 | 24 | 48; usingSstart,Tperiod/time,Rnumber of repeats.S-48T48R2 | 80 | 90 | S100T12R2 = -48|0|80|90|100|112
Outputs and timecourses
The actual data in publication is available either from tables, figures or stated with the text.
The information is curated either as excel spreadsheets (preferred method) or can be directly stored in the study.json (legacy method).
Example spreadsheets for a timecourse and for a table of pharmacokinetics data are provided below.
Keep numerical data in the study workbook, with sheets corresponding to the source tables and figure panels. See Getting started for the spreadsheet and digitization tools and their settings.
Figures
- Open the image to digitize (
STUDYNAME_Fig[1-9]*.png) - Calibrate the axes, accounting for logarithmic scales where necessary. Check the calibration carefully: errors introduce systematic bias into every extracted point.
- Digitize one curve at a time
- Digitize mean and error separately (the error magnitude can then be calculated as the absolute difference between the mean and the error-bar endpoint)
- In case of time courses adapt the time points to the actual times reported in the publication
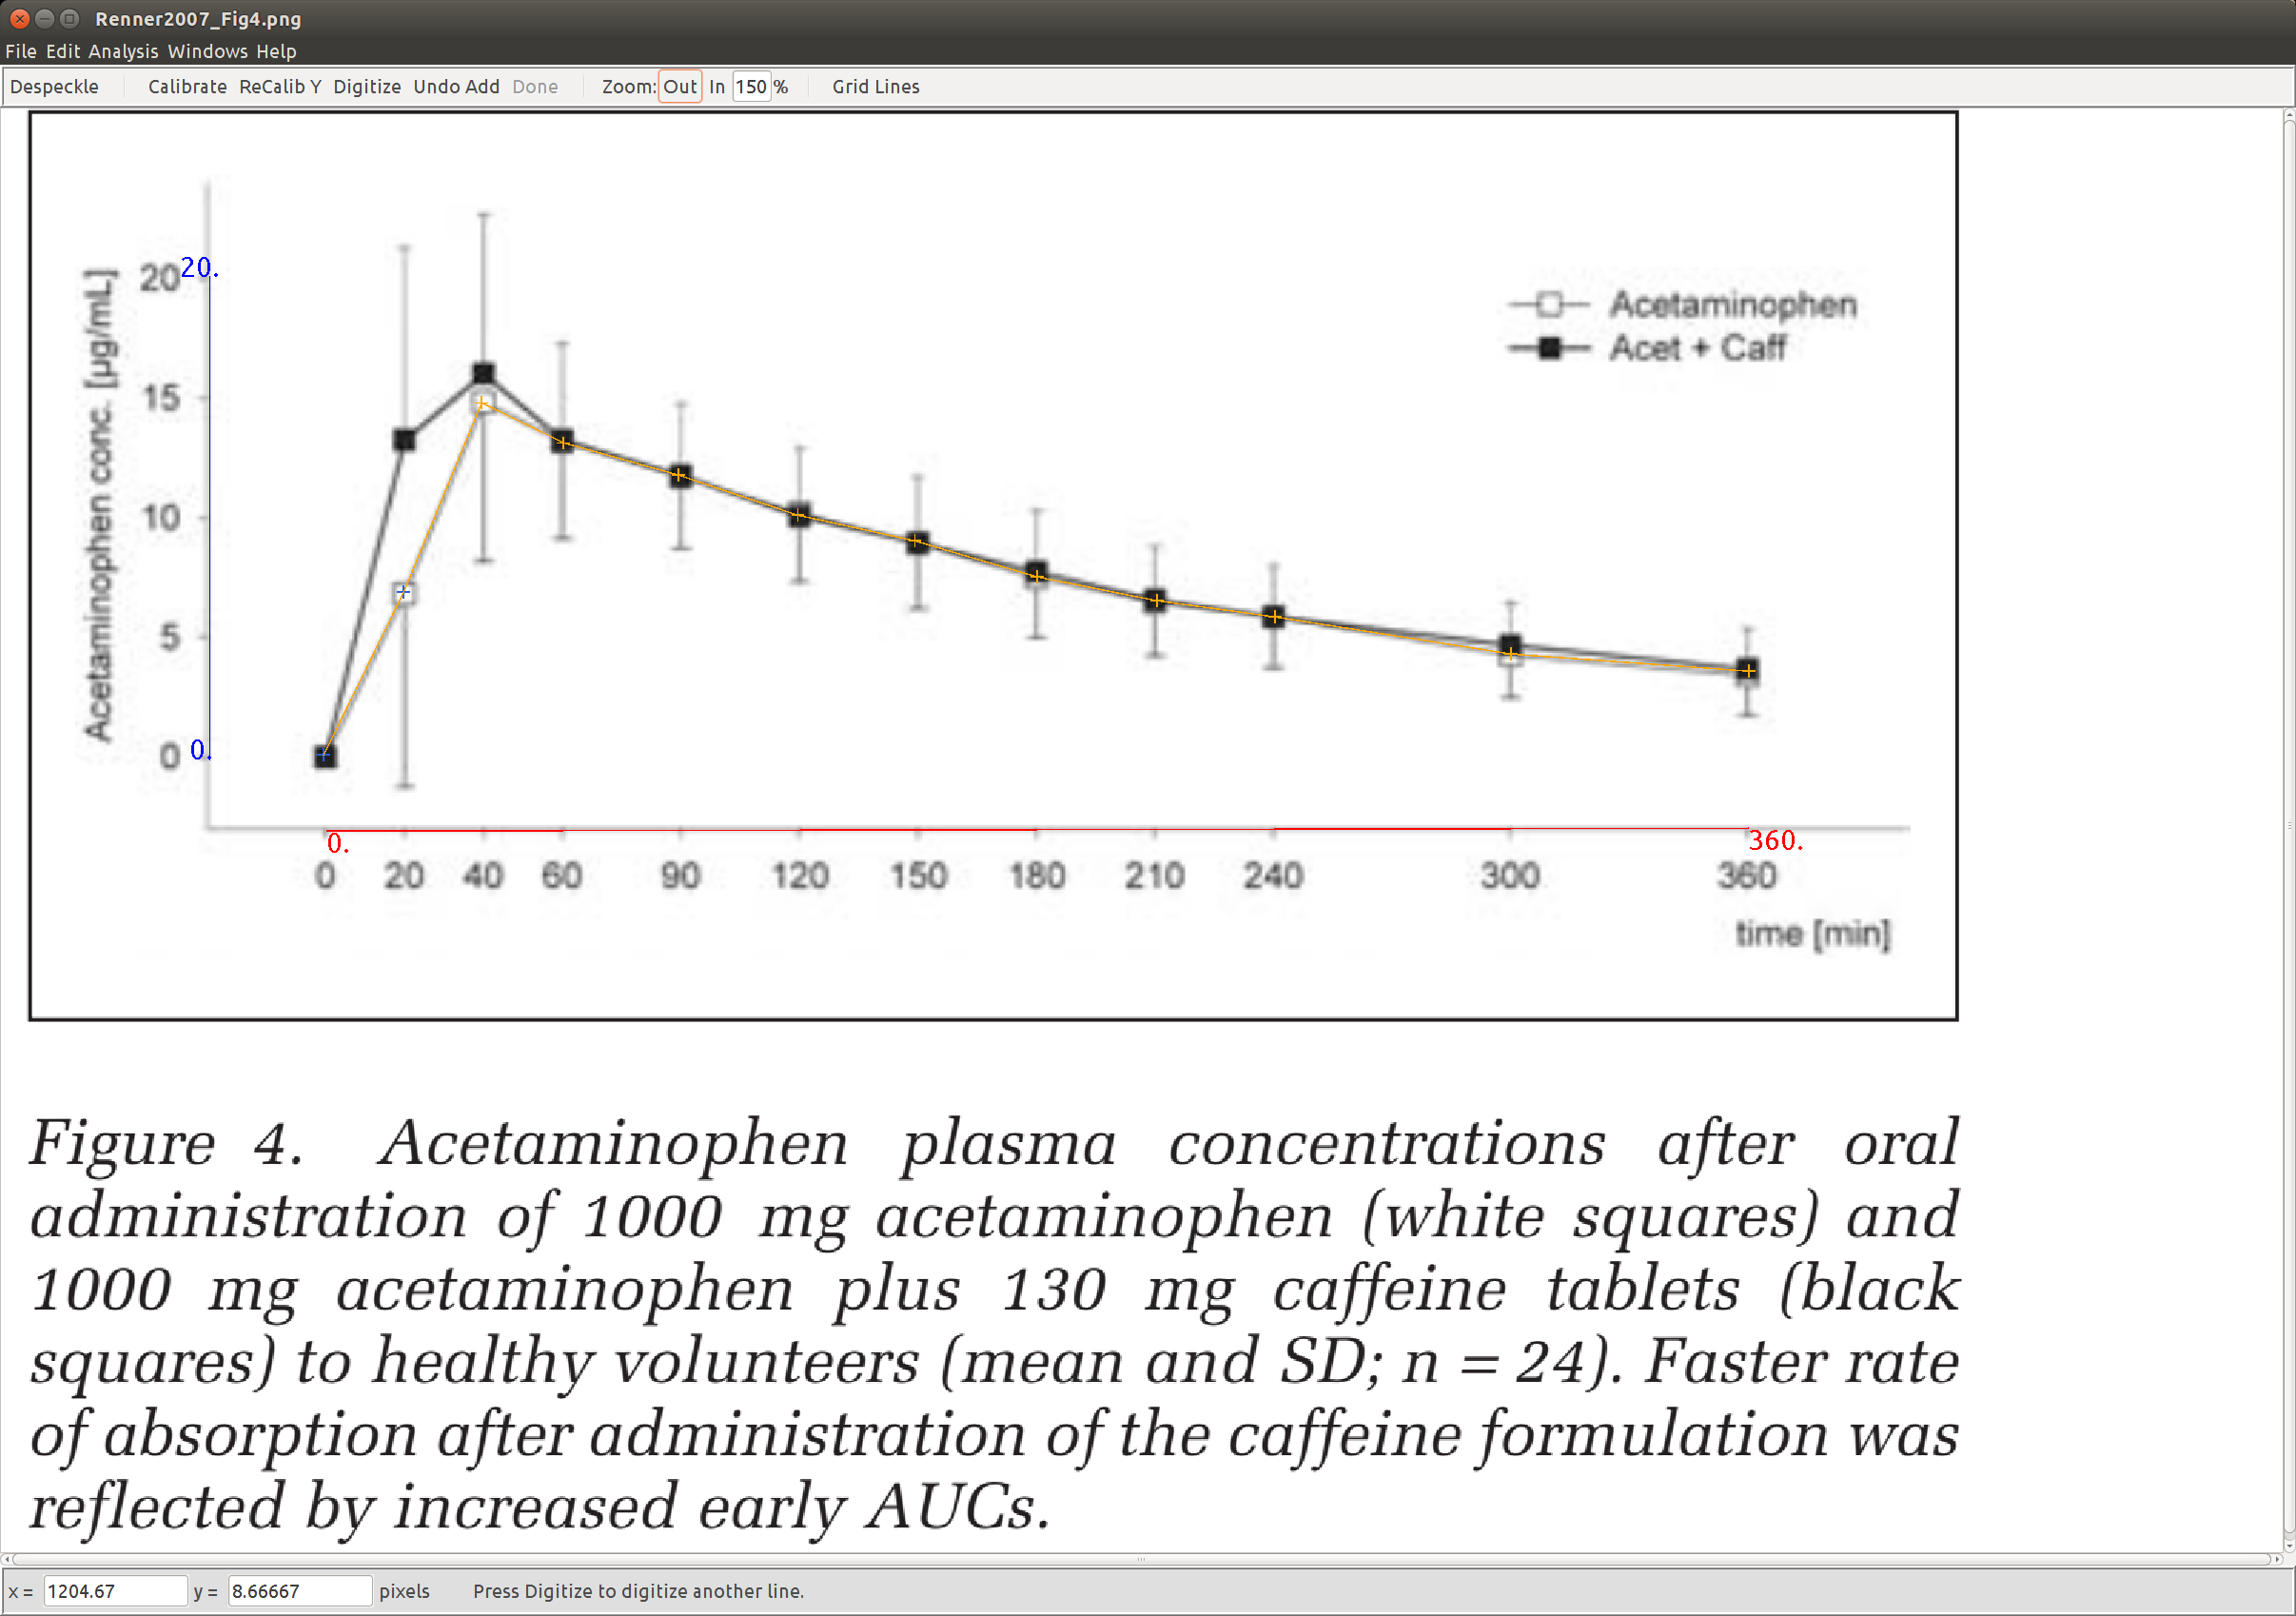
Some tips for digitization of figures:
- Check that axes do not have any breaks or different scales (sometimes an axis is continued or not scaled equally). This will create problems in the digitization.
- use the same axes calibration for all curves in a figure, i.e., always finish all data from a single figure panel completely in one go (otherwise different bias for the different curves)
- The left lower corner is not always
(0,0), use the minimal x-tick an y-tick with available numerical values - set the number of digits to a reasonable value (2-3 digits)
Tables
For tables the data is copied in spreadsheets.
Encoding outputs and timecourses
Outputs and timecourses should be stored based on mappings to the excel tables. The main mechanism is hereby mapping of columns to fields in the output.
For instance in the following example the timecourse data from the excel sheet Fig3A is used
in the timecourses of the study.json (example from studies/midazolam/Allonen1981).
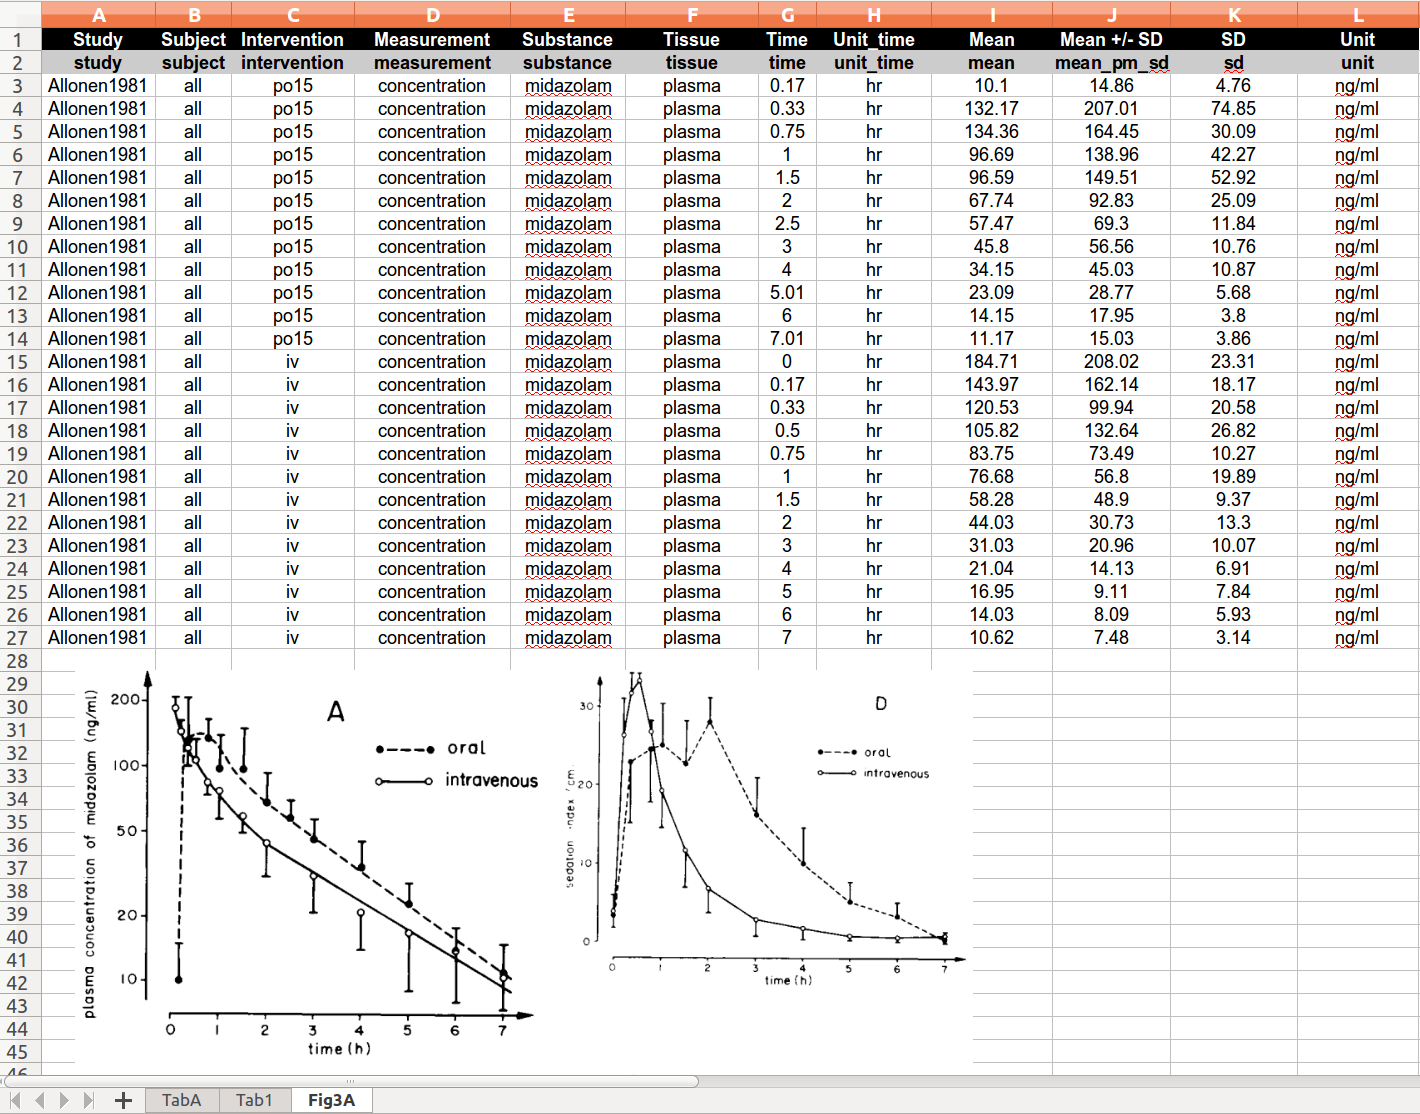
In the timecourse the columns from the table header are mapped to the fields, e.g. the intervention
is mapped via "interventions": "col==intervention". Data can also be directly encoded in the study.json,
but whenever possible data should be defined via mappings.
"timecourses": [
  {
    "figure": "Fig3",
    "source": "Fig3A",
    "group": "col==subject",
    "groupby": "intervention",
    "interventions": "col==intervention",
    "substance": "col==substance",
    "tissue": "col==tissue",
    "measurement_type": "col==measurement",
    "time": "col==time",
    "time_unit": "col==time_unit",
    "mean": "col==mean",
    "sd": "col==sd",
    "unit": "col==unit"
  }
]
Tab1 and the individual and group outputs are created from the single sheet (example from studies/midazolam/Allonen1981).
The pharmacokinetic data from the following table is encoded
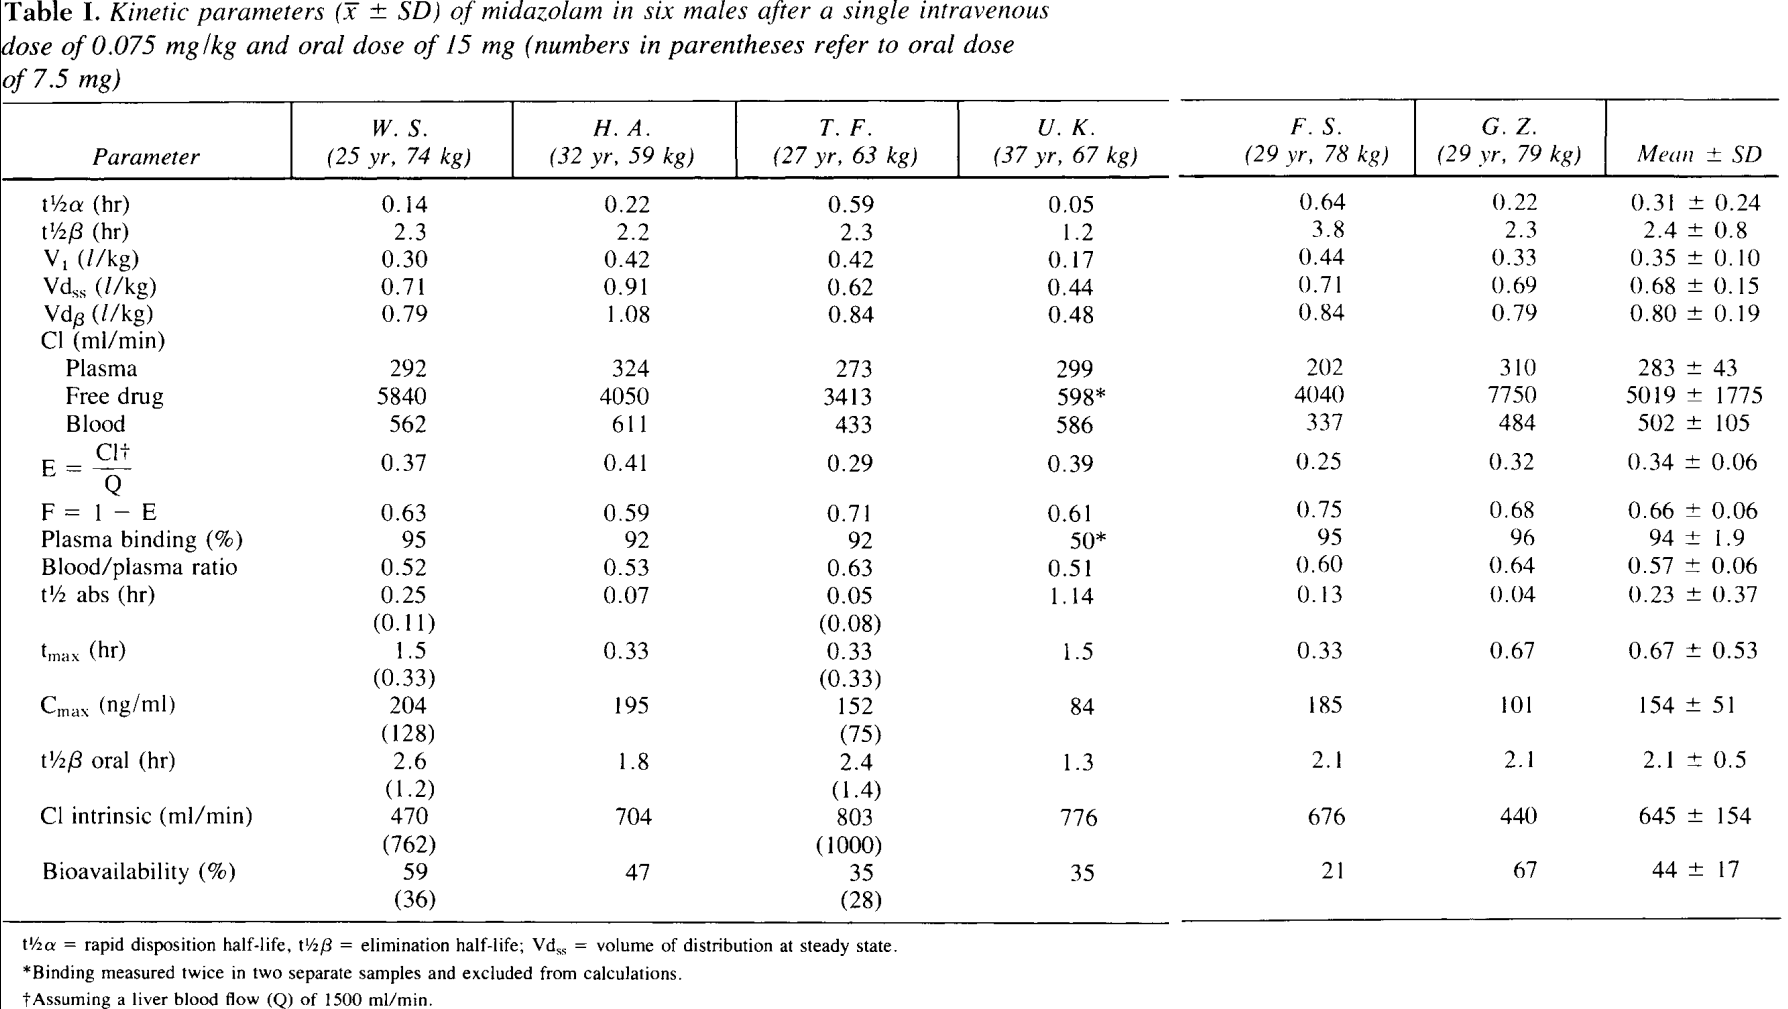
Which is stored in the excel sheet Tab1 of studies/midazolam/Allonen1981.xlsx
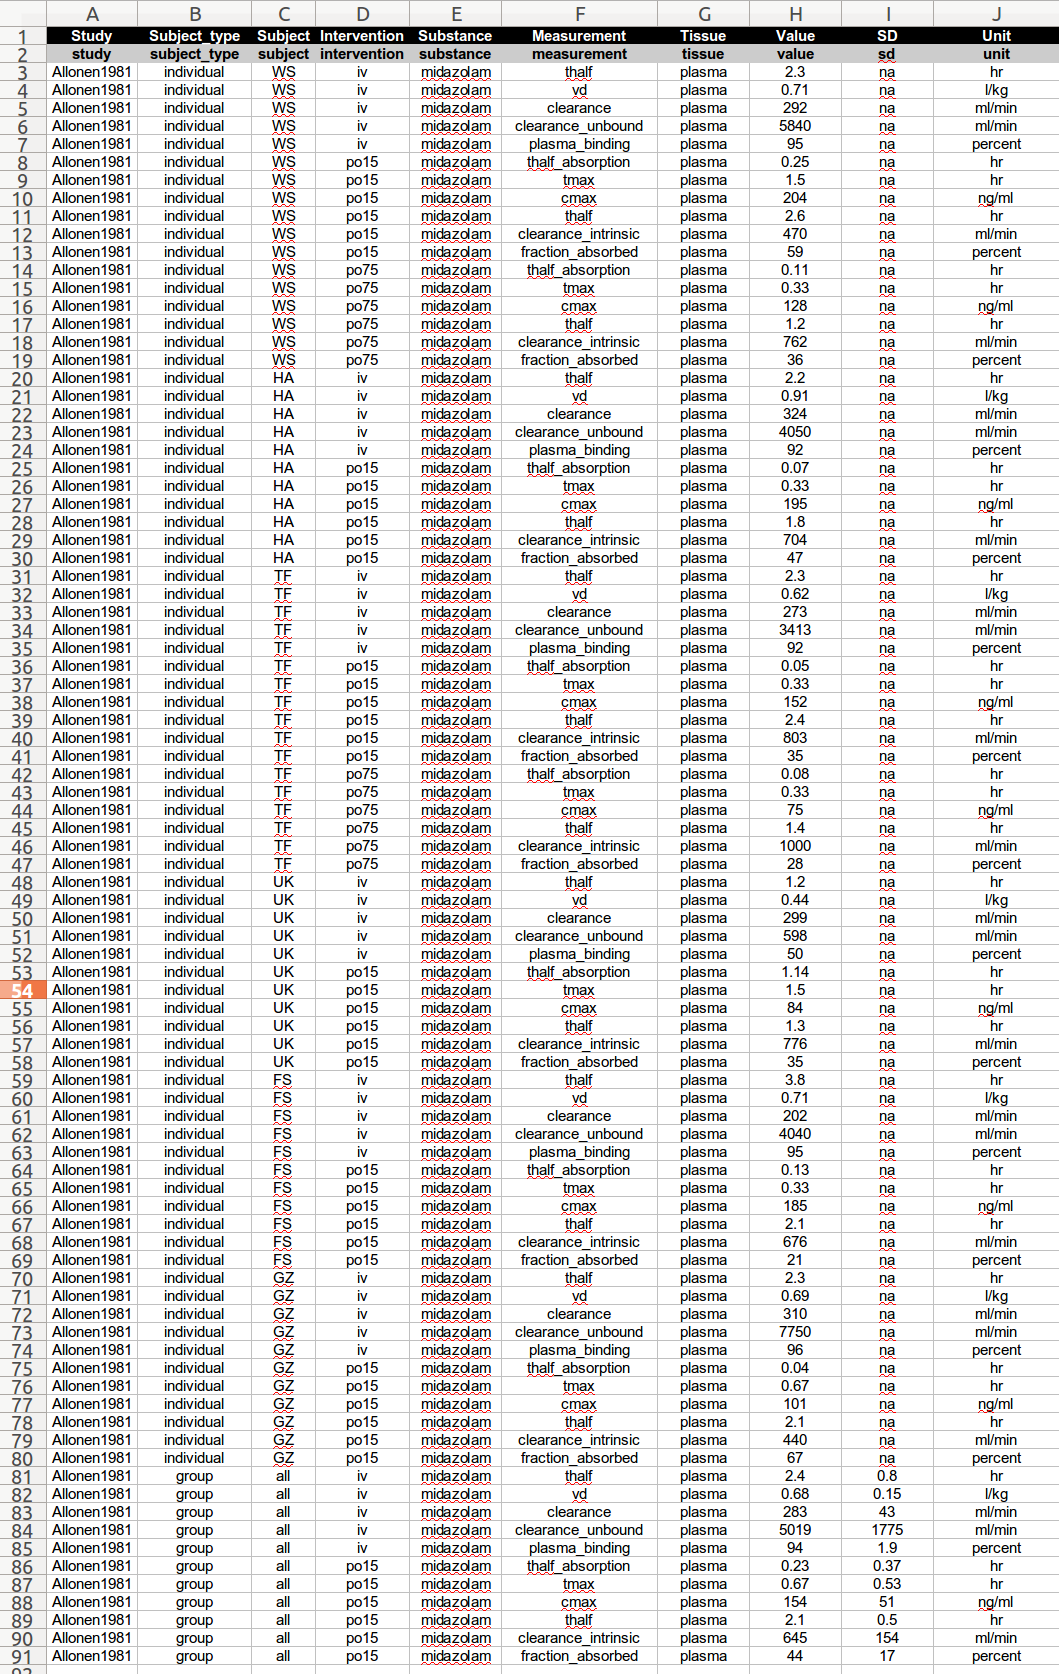
The mapping is performed by selecting a subset of the table for either the individuals ("subset": "subject_type==individual") or the groups ("subset": "subject_type==group")
based on a given column. Then the mapping of the columns is performed
"outputs": [
  {
    "figure": "Tab1",
    "source": "Tab1",
    "subset": "subject_type==individual",
    "individual": "col==subject",
    "interventions": "col==intervention",
    "substance": "col==substance",
    "tissue": "col==tissue",
    "measurement_type": "col==measurement",
    "value": "col==value",
    "unit": "col==unit"
  },
  {
    "figure": "Tab1",
    "source": "Tab1",
    "subset": "subject==all",
    "group": "col==subject",
    "interventions": "col==intervention",
    "substance": "col==substance",
    "tissue": "col==tissue",
    "measurement_type": "col==measurement",
    "mean": "col==value",
    "sd": "col==sd",
    "unit": "col==unit"
  }
]