Webinterface
Open beta.pk-db.com to explore PK-DB in your browser. No installation is needed. Public study browsing is available without an account; downloads and access to shared private studies require sign-in.
The screenshots below show the current frontend with artificial demonstration data. Study names, counts, and values illustrate the interface, not scientific results from the public collection. Select a screenshot to view it at full size.
For a scientific example of how a publication is represented in PK-DB, see the example study.
Explore database coverage
The landing page shows current totals and interactive charts for studies, substances with timecourses, and PK parameter values. Choose a year range, switch studies and substances between annual and cumulative counts, or select a PK parameter to compare reported and calculated values. The substance chart ranks current timecourse coverage.
Hover for values, drag to zoom, and double-click to reset. Each chart includes a data table and a PNG download. Counts reflect studies you can access and refresh when your session changes. Years use the study date; undated studies appear in current totals and a separate notice. Cumulative substance counts include each substance only once. These charts describe the current collection by study date, not earlier database snapshots.
Find studies
Open Explore data to reach Search pharmacokinetic data. The research filters appear on the left on a desktop; on a smaller screen, open Filters and Search.
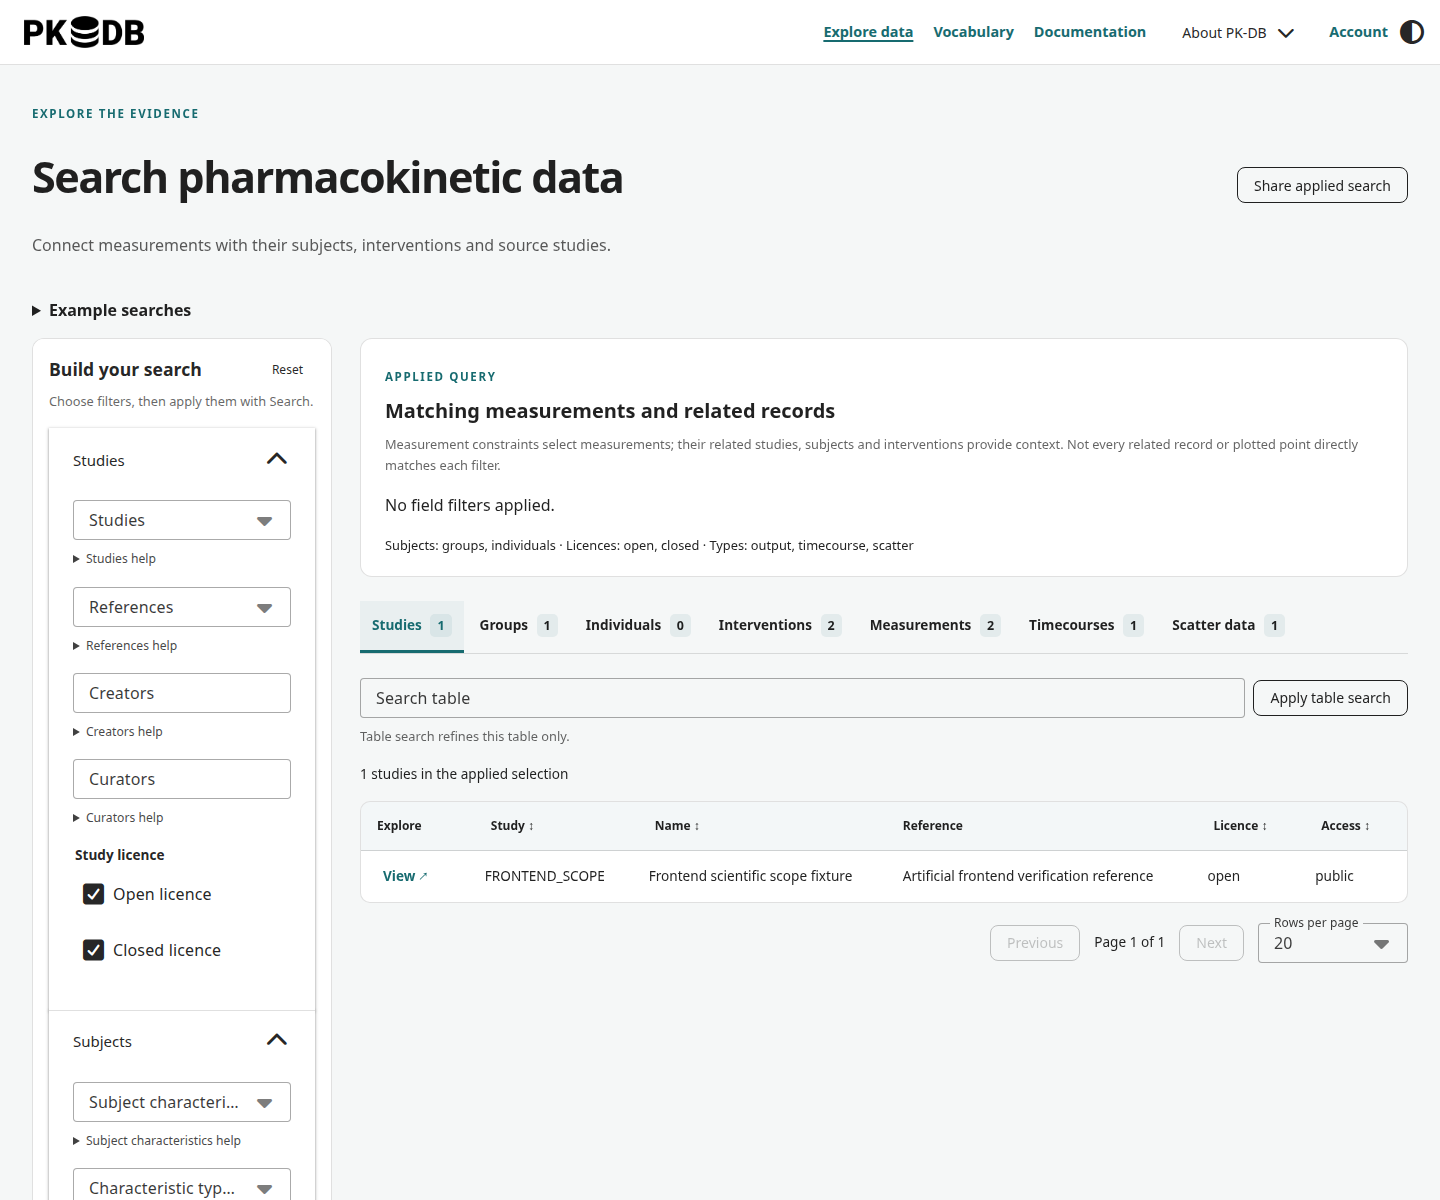
- Choose the substances, measurement types, subject characteristics, or study criteria relevant to your question.
- Select the subject types, licences, and measurement types you want to include.
- Choose Search to apply the filters. Editing a filter changes the draft; it does not change the results until you search.
- Review the applied selection and the counts beside each result category.
The example searches load a draft you can inspect and adjust before choosing Search. If no results match, broaden the filters and search again.
Choose the scope of your search
Matching measurements and related records selects measurements matching the constraints and returns their associated study, subject, and intervention context. Related records may contain information beyond the individual match.
All data from qualifying studies returns the broader study context. Different records within one study can satisfy different conditions, so not every returned measurement necessarily matches every filter.
Use Share applied search to copy the current search link. The link preserves criteria; it does not freeze the data or grant another person access to private studies.
Browse measurements and related records
Switch between Studies, Groups, Individuals, Interventions, Measurements, Timecourses, and Scatter data to explore the same applied selection from different perspectives.
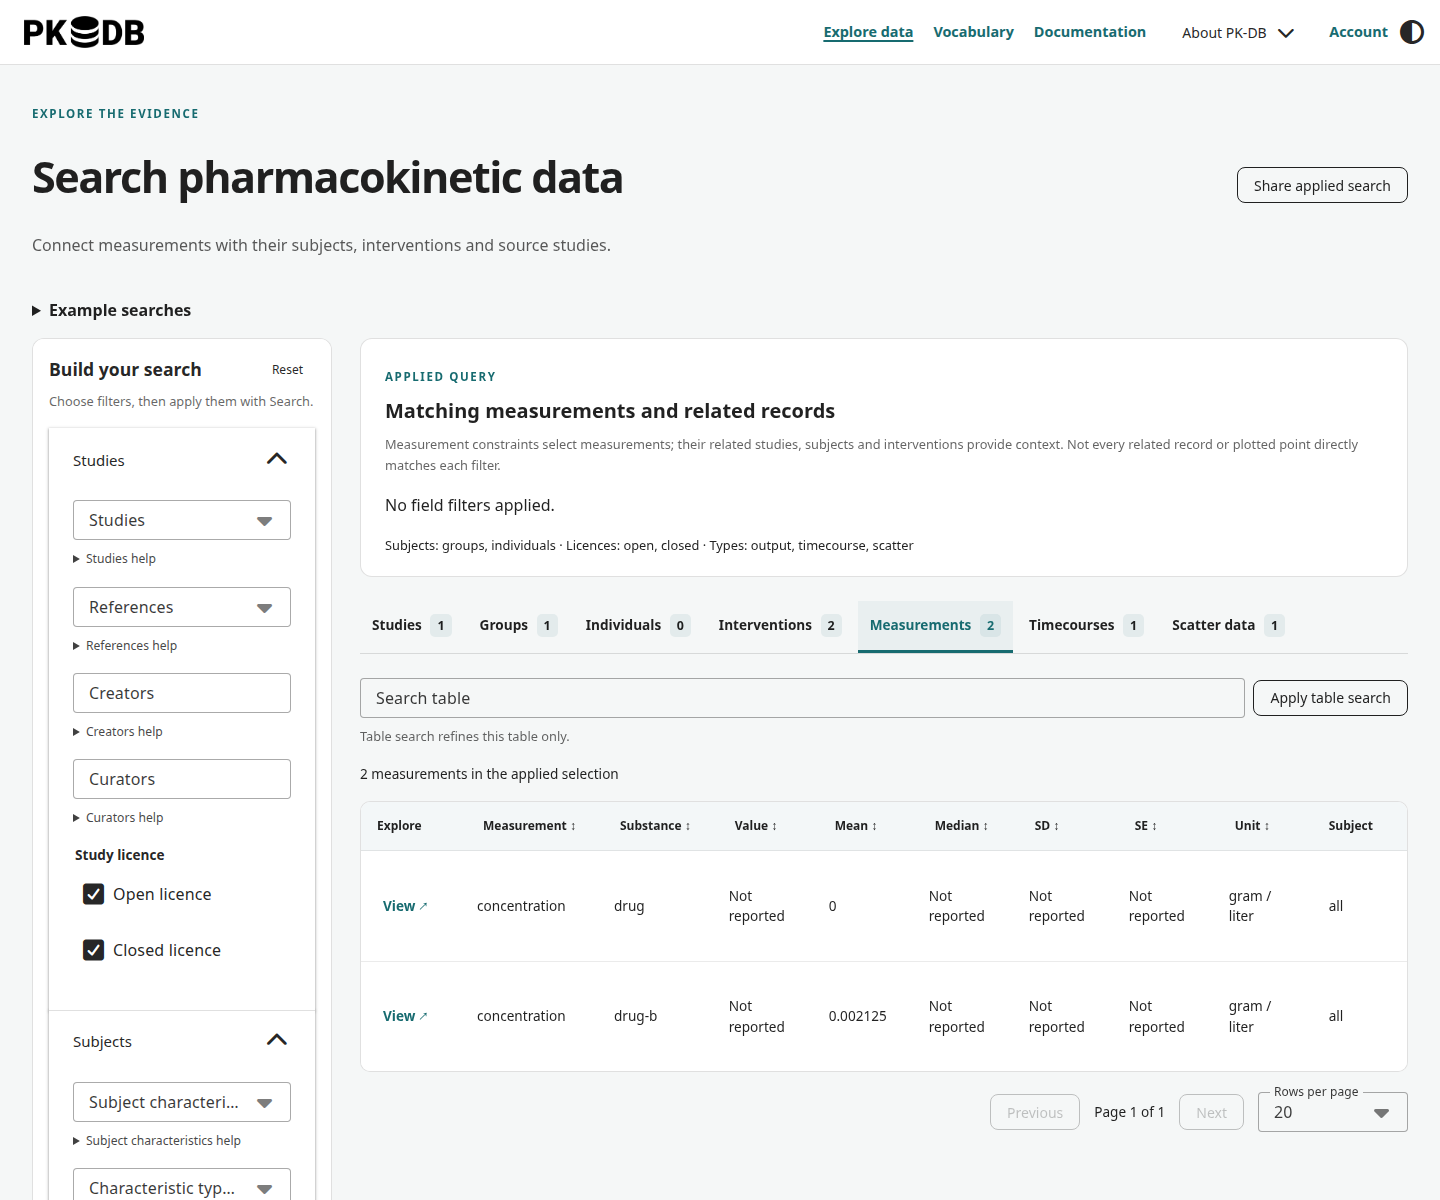
Read the measurement type, substance, unit and Value together. The Value column shows one value per row: the arithmetic mean, else the median, else the geometric mean, followed by its spread (± SD, ± SE or the coefficient of variation in percent, and for a geometric mean ×/÷ GSD or the geometric coefficient of variation) and the range when minimum and maximum are reported. A dash marks every empty cell. Statistics and times are shown with four significant digits and the stored values are unchanged, and the value of a single subject or of a summary whose statistic the publication does not state appears as a plain number. Interventions show their dosing schedule as a list of times (0, 12, 40 h) or as a regular schedule (every 24 h, 7 doses from 0 h). Open a record to inspect its subject and intervention context before comparing values across studies.
Search table refines only the current table; choose Apply table search to apply it. It does not replace the research filters. Use column sorting and Previous / Next to navigate longer result sets. The Value column sorts by the same mean, median or geometric mean that it shows, and rows without a value come last.
Open a study
Select a study in the results to view its publication, metadata, and associated data. A study opens at /data/<substance>/<name>, for example /data/caffeine/Harder1988. Links by the PKDB identifier of a released study, such as /data/PKDB00198, or by the former study format 1 identifier of a migrated study, such as /data/Vilsboll2008, keep working and lead to the same page, also after the study is renamed. A status strip at the top of the study shows its Identifier, PKDB identifier, Released date, Curation issue (a link to the issue on GitHub), and Review status (draft, in review or approved) with the number of open review items; entries that a study does not have are left out. To find a study by its PKDB identifier, search for it or use the PKDB identifiers filter. Under Explore all data from this study, choose a Study data category to browse its groups, individuals, interventions, measurements, or series.
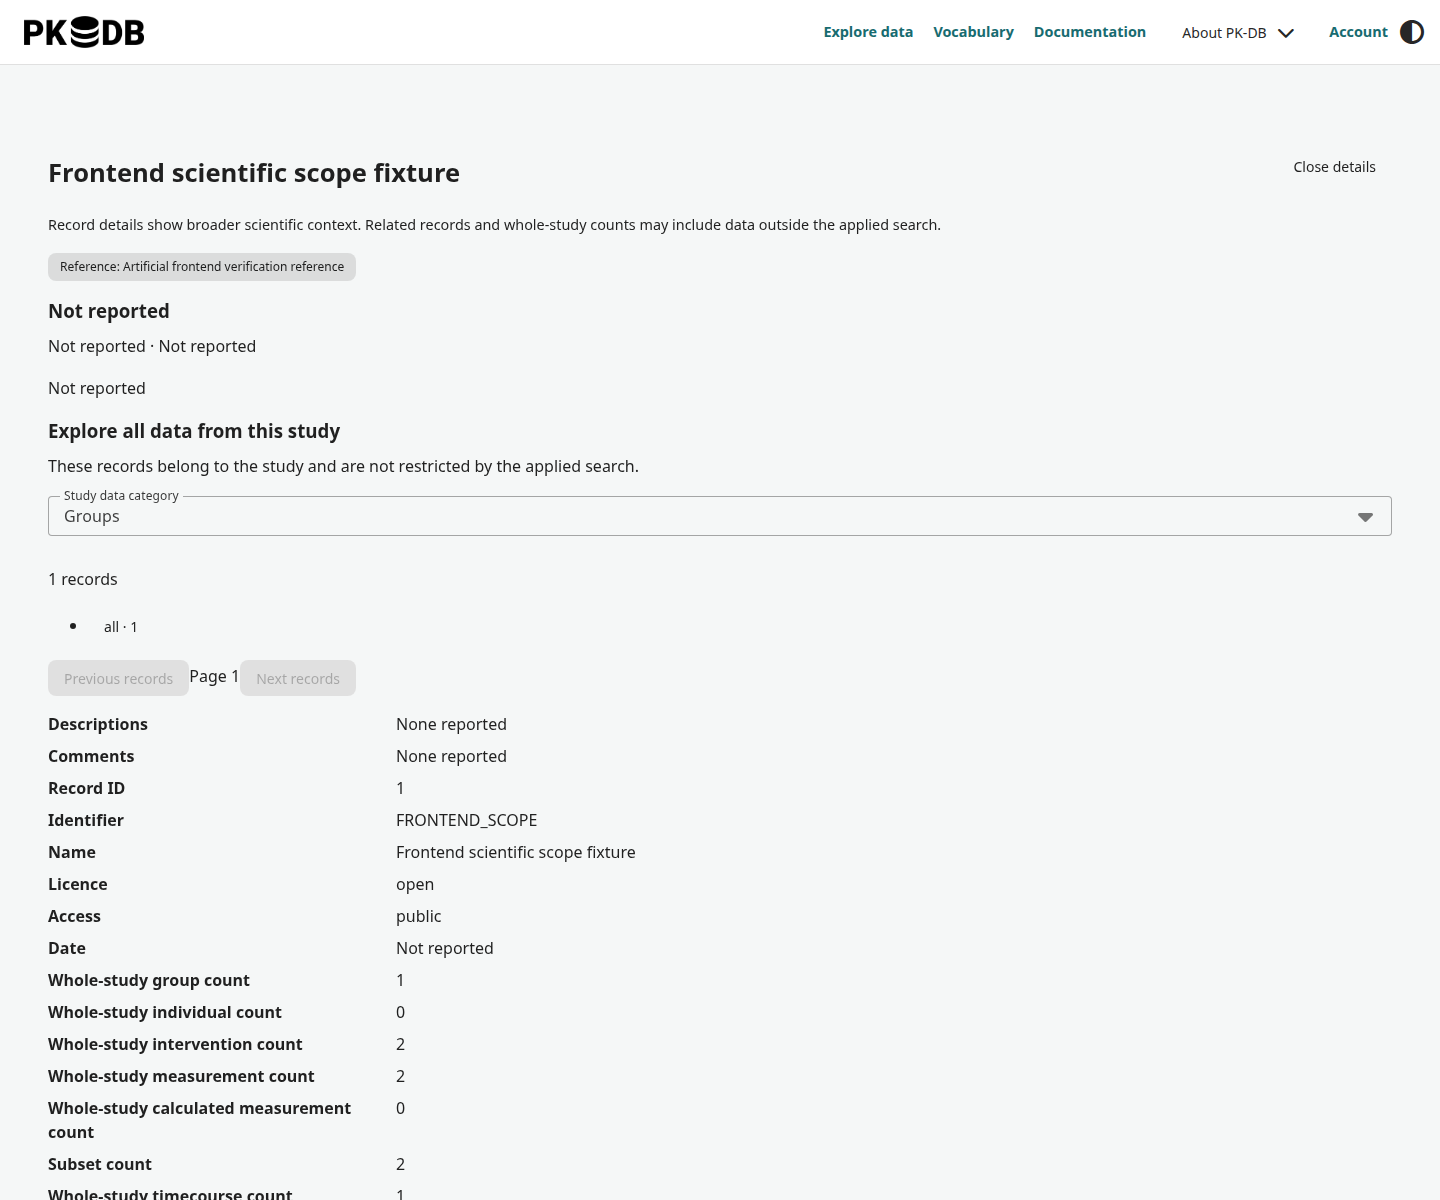
Related-record buttons let you follow links between a measurement, its subject, and its intervention. Back to previous record retraces that exploration; Close details returns to the search. Study details can include records outside your applied search because they show the study's broader context.
Explore timecourses and scatter data
Open a timecourse record and choose Show timecourse plot, or open a scatter record and choose Show scatter plot. Inspect axis labels and units, and use Accessible plot data and uncertainty to read the values as a table.
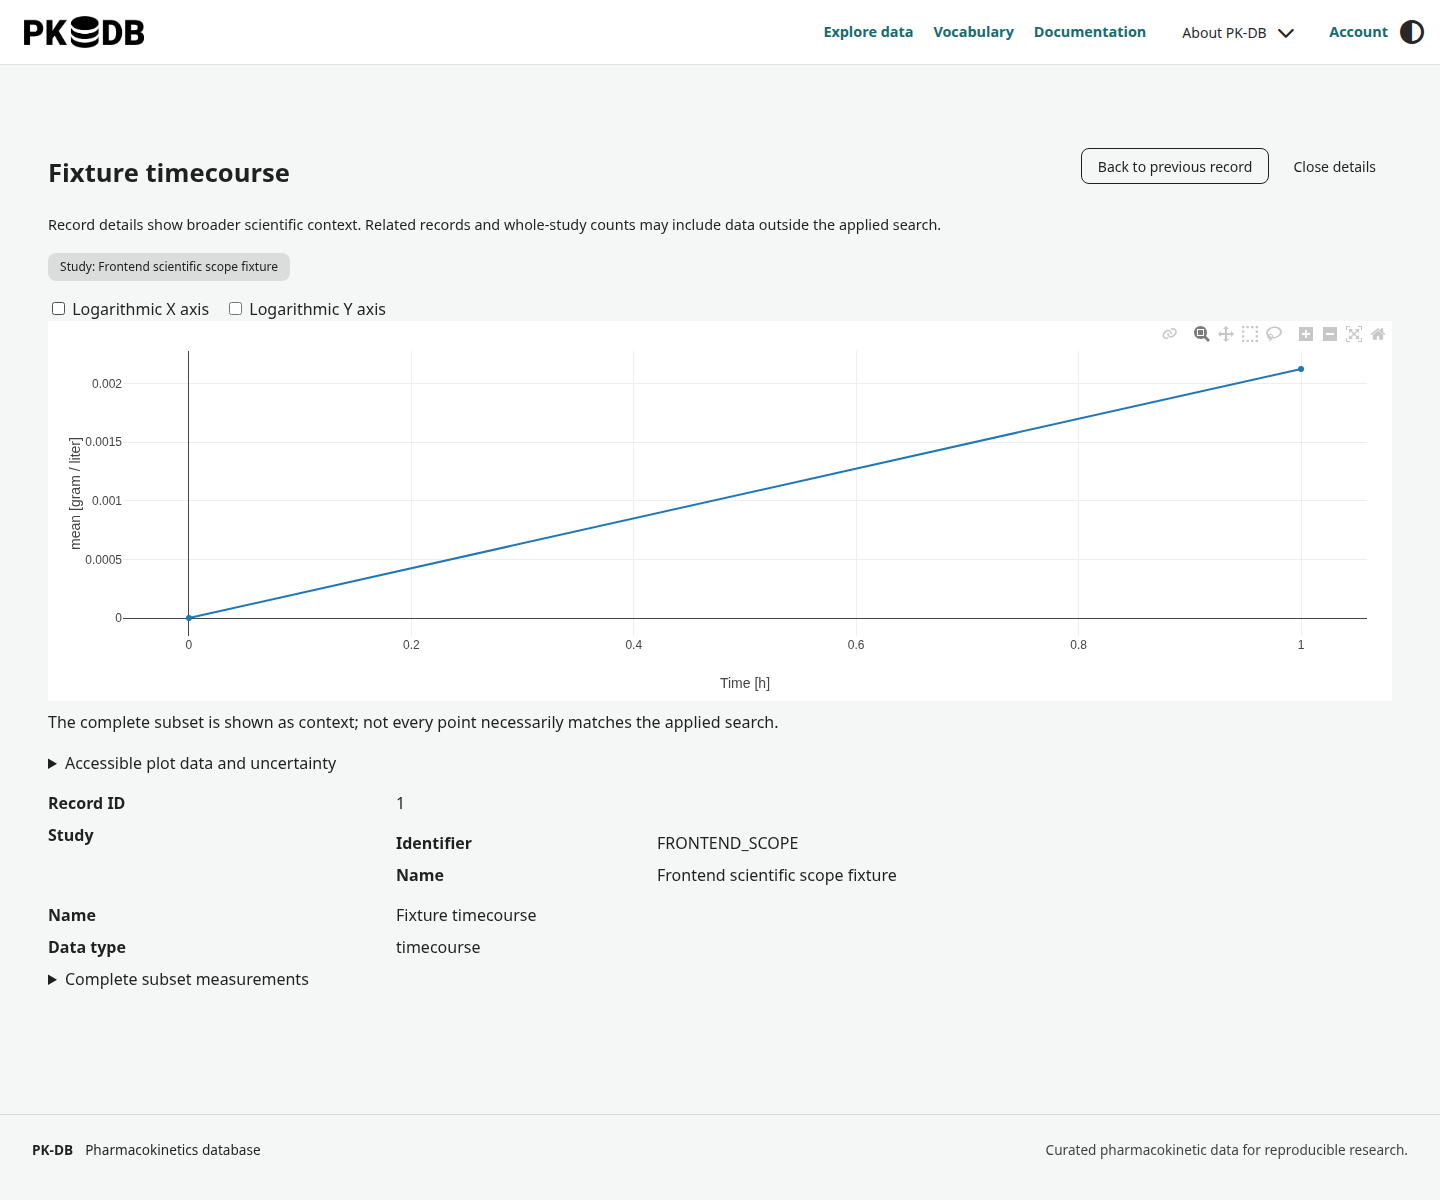
A plot shows the complete subset as context, including points that may not individually match your search. A logarithmic axis cannot display zero or negative values; check the accompanying table when these are relevant.
Sign in and download
Open Account to sign in with your username and password. If you need an account or an API key, follow Accounts and API keys.
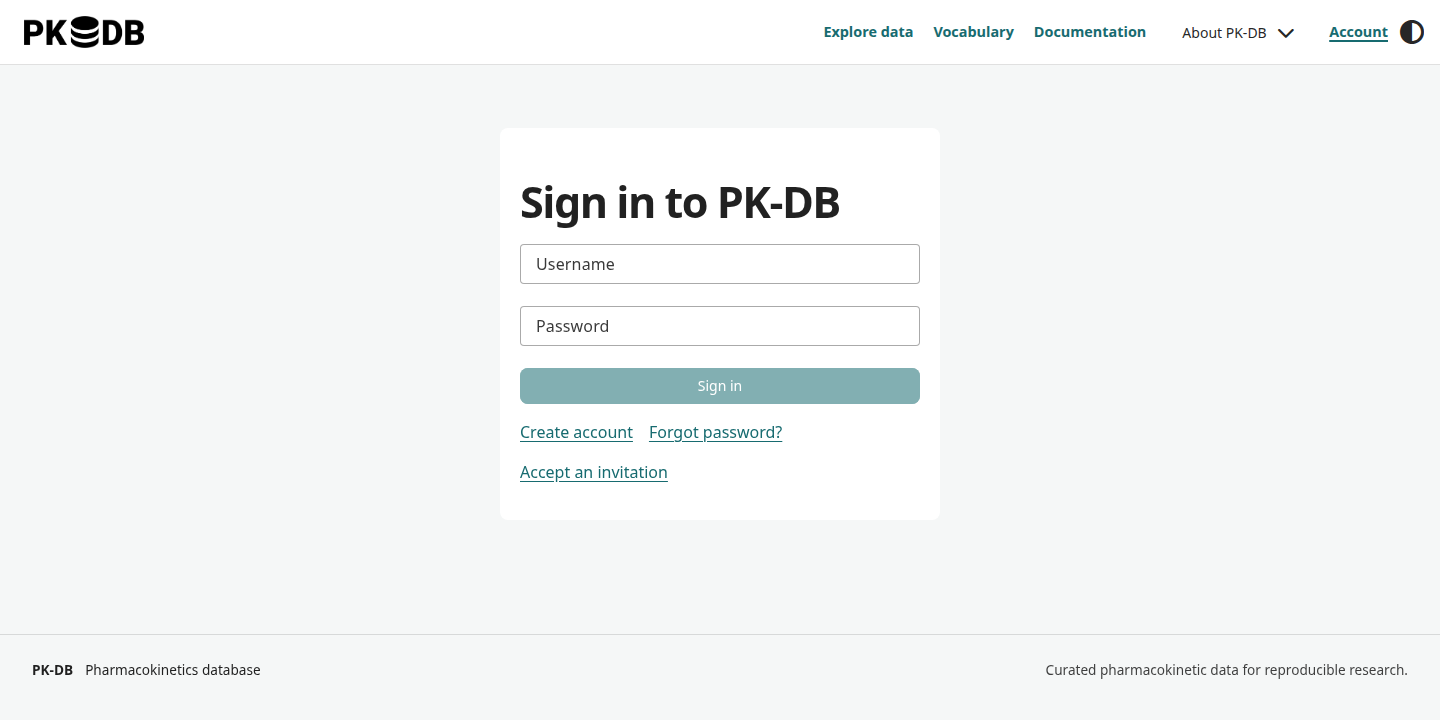
Study attachments are listed in the study details when available to your account. Sign in before opening or downloading them. For a reproducible dataset download with explicit filters, use the Python client or REST API.
Review the study licence and cite the underlying publication and PK-DB when using the data.